
International
ADVANCED AND APPLIED SCIENCES
EISSN: 2313-3724, Print ISSN: 2313-626X
Frequency: 12
![]()
Volume 13, Issue 3 (March 2026), Pages: 207-211

----------------------------------------------
Original Research Paper
GIS-based wildfire risk and social vulnerability mapping for smart grid resilience in Riverside County
Author(s):
Affiliation(s):
College of Business and Economics, California State University, Los Angeles, United States
Full text

* Corresponding Author.
 Corresponding author's ORCID profile: https://orcid.org/0000-0002-1066-5212
Digital Object Identifier (DOI)
https://doi.org/10.21833/ijaas.2026.03.021
Abstract
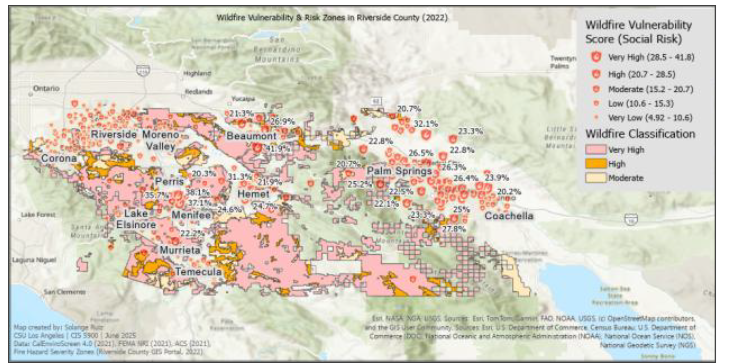
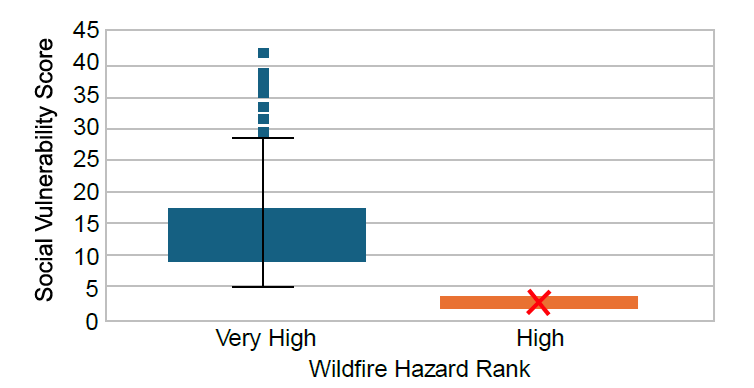
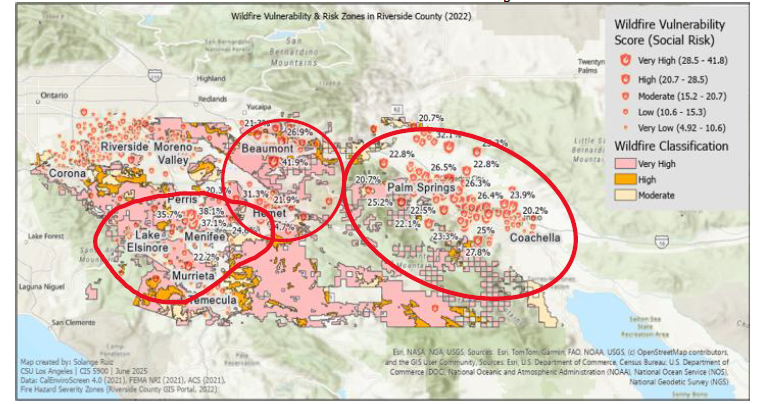
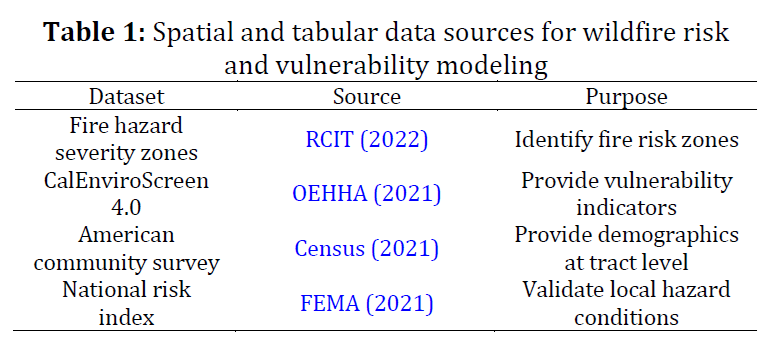
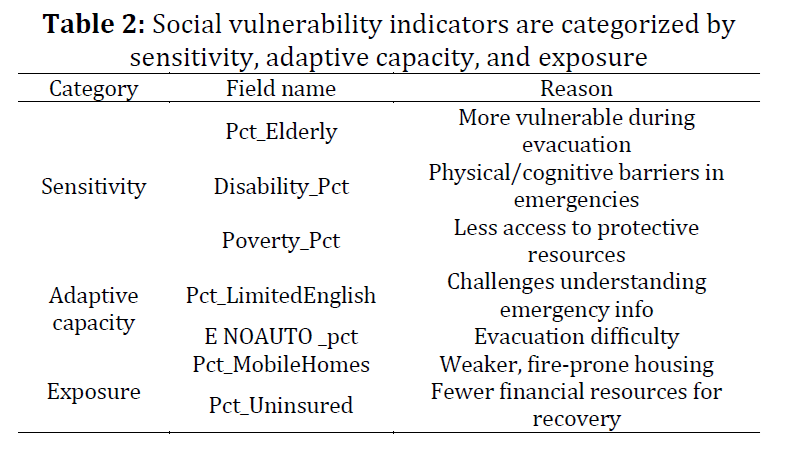
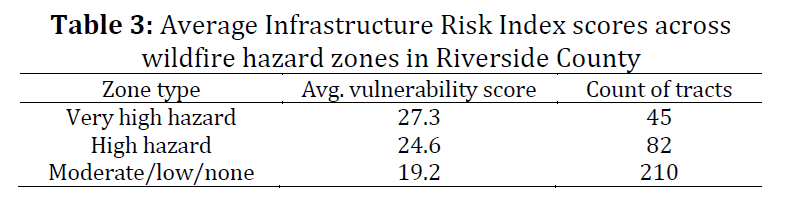
Wildfire poses a growing risk to California’s electric grid. In Riverside County, fires ignited near overhead distribution lines and substations lead to power outages and public safety shutoffs, which place a disproportionate burden on disadvantaged communities. This study develops an energy-aware decision-support framework to identify census tracts where wildfire hazard severity overlaps with social and infrastructure vulnerability. Data were obtained from the Riverside County GIS portal, CalEnviroScreen 4.0, and U.S. Census and American Community Survey variables, including income, age, disability, housing conditions, and transportation access. An Infrastructure Risk Index (IRI) was constructed by normalizing and aggregating indicators of sensitivity, adaptive capacity, and exposure, and then integrating wildfire hazard severity to prioritize at-risk assets. Results from a two-sample t-test show that IRI values are significantly higher in areas classified as high and very high wildfire hazard zones, confirming a strong association between fire risk and social vulnerability. The resulting spatial outputs provide actionable guidance for utilities and emergency managers, including vegetation management near power lines, targeted inspections of transformers and switches, equitable placement of emergency resources, and informed funding decisions. The framework can incorporate near–real-time data, such as weather conditions or sensor inputs, and user-defined alert thresholds to support proactive maintenance. By prioritizing under-resourced communities, this approach contributes to improved grid resilience, enhanced public safety, and more equitable wildfire risk mitigation in Riverside County.
© 2026 The Authors. Published by IASE.
This is an
Keywords
Wildfire risk, Electric grid resilience, Social vulnerability, Infrastructure risk index, Decision-support framework
Article history
Received 23 September 2025, Received in revised form 30 January 2026, Accepted 14 March 2026
Acknowledgment
No Acknowledgment.
Compliance with ethical standards
Conflict of interest: The author(s) declared no potential conflicts of interest with respect to the research, authorship, and/or publication of this article.Citation:
Sultan V, Ruiz S, and Wilson DT (2026). GIS-based wildfire risk and social vulnerability mapping for smart grid resilience in Riverside County. International Journal of Advanced and Applied Sciences, 13(3): 207-211
Figures
Fig. 1 Fig. 2 Fig. 3 Fig. 4 Fig. 5
Tables
----------------------------------------------
References (11)
Census (2021). American community survey (ACS) 5-Year Estimates. United States Census Bureau. Available online at: https://data.census.gov/
Davies IP, Haugo RD, Robertson JC, and Levin PS (2018). The unequal vulnerability of communities of color to wildfire. PLOS ONE, 13(11): e0205825. https://doi.org/10.1371/journal.pone.0205825 [Google Scholar] PMid:30388129 PMCid:PMC6214520
FEMA (2021). National risk index (NRI). Federal Emergency Management Agency. Available online at: https://hazards.fema.gov/nri/
Han SY, Lee Y, Yoo J, Kang JY, Park J, Myint SW, Cho E, Gu X, and Kim JS (2025). Spatial disparities in fire shelter accessibility: Capacity challenges in the Palisades and Eaton fires. Arxiv Preprint Arxiv:2506.06803. https://doi.org/10.48550/arXiv.2506.06803 [Google Scholar]
Lambrou N, Kolden C, Loukaitou-Sideris A, Anjum E, and Acey C (2023). Social drivers of vulnerability to wildfire disasters: A review of the literature. Landscape and Urban Planning, 237: 104797. https://doi.org/10.1016/j.landurbplan.2023.104797 [Google Scholar]
Li Z, Li H, Yang Y, Wang S, and Zhu Y (2025). Integrating earth observation data into the tri-environmental evaluation of the economic cost of natural disasters: A case study of 2025 LA wildfire. Arxiv Preprint Arxiv:2505.01721. https://doi.org/10.48550/arXiv.2505.01721 [Google Scholar]
OEHHA (2021). CalEnviroScreen 4.0. Office of Environmental Health Hazard Assessment, Oakland, USA. Available online at: https://oehha.ca.gov/calenviroscreen
RCIT (2022). Fire hazard severity zones. Riverside County GIS Portal. Available online at: https://gis.rivco.org/Portal/
Reilley C, Dunn CJ, Crandall MS, and Kline JD (2024). Socially vulnerable US Pacific Northwest communities are more likely to experience wildfires. Environmental Research Letters, 19(9): 094053. https://doi.org/10.1088/1748-9326/ad6cec [Google Scholar]
Schoennagel T, Balch JK, Brenkert-Smith H, Dennison PE, Harvey BJ, Krawchuk MA, Mietkiewicz N, Morgan P, Moritz MA, Rasker R, Turner MG, and Whitlock C (2017). Adapt to more wildfire in western North American forests as climate changes. Proceedings of the National Academy of Sciences, 114(18): 4582-4590. https://doi.org/10.1073/pnas.1617464114 [Google Scholar] PMid:28416662 PMCid:PMC5422781
- Xie W and Meng Q (2025). Social vulnerability analysis of planned power outages: A spatial study of power outage in California caused by wildfire risk. Sustainable Cities and Society, 120: 106163. https://doi.org/10.1016/j.scs.2025.106163 [Google Scholar]