
International
ADVANCED AND APPLIED SCIENCES
EISSN: 2313-3724, Print ISSN: 2313-626X
Frequency: 12
![]()
Volume 10, Issue 7 (July 2023), Pages: 138-144

----------------------------------------------
Original Research Paper
Identifying low-performing regions in Moroccan education: A deep learning approach using the PISA dataset
Author(s):
Ilyas Tammouch 1, *, Abdelamine Elouafi 1, Souad Eddarouich 2, Raja Touahni 1
Affiliation(s):
1Telecommunications Systems and Decision Engineering Laboratory, Faculty of Science, Ibn Tofail University, Kenitra, Morocco
2Regional Educational Center, Rabat, Morocco

* Corresponding Author.
 Corresponding author's ORCID profile: https://orcid.org/0000-0003-2752-4413
Digital Object Identifier:
https://doi.org/10.21833/ijaas.2023.07.015
Abstract:
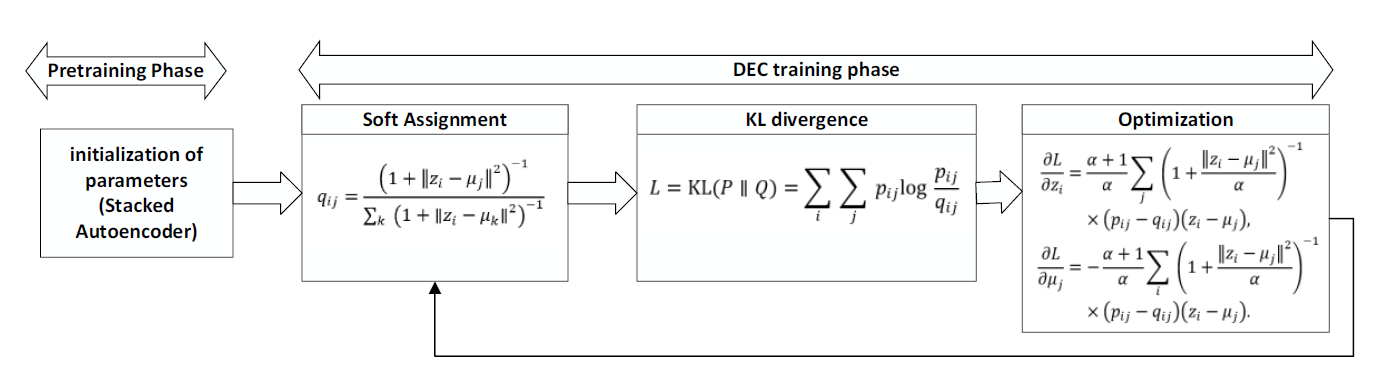
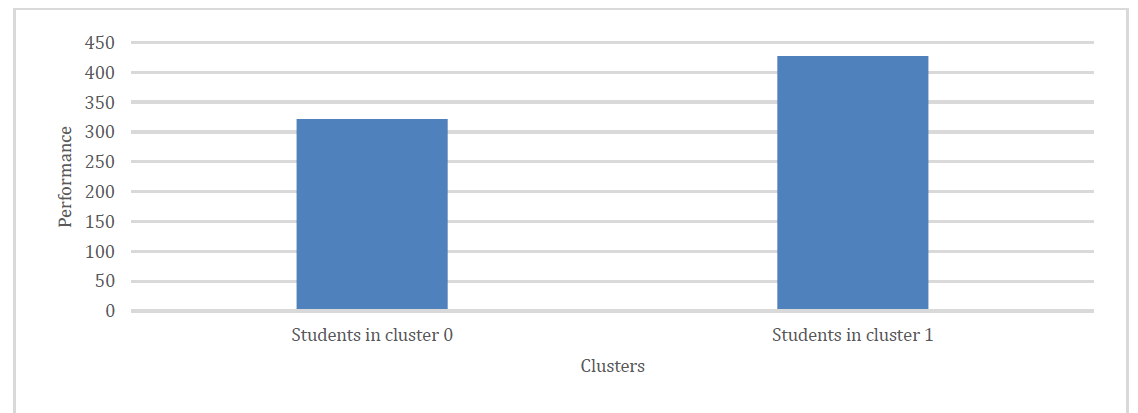
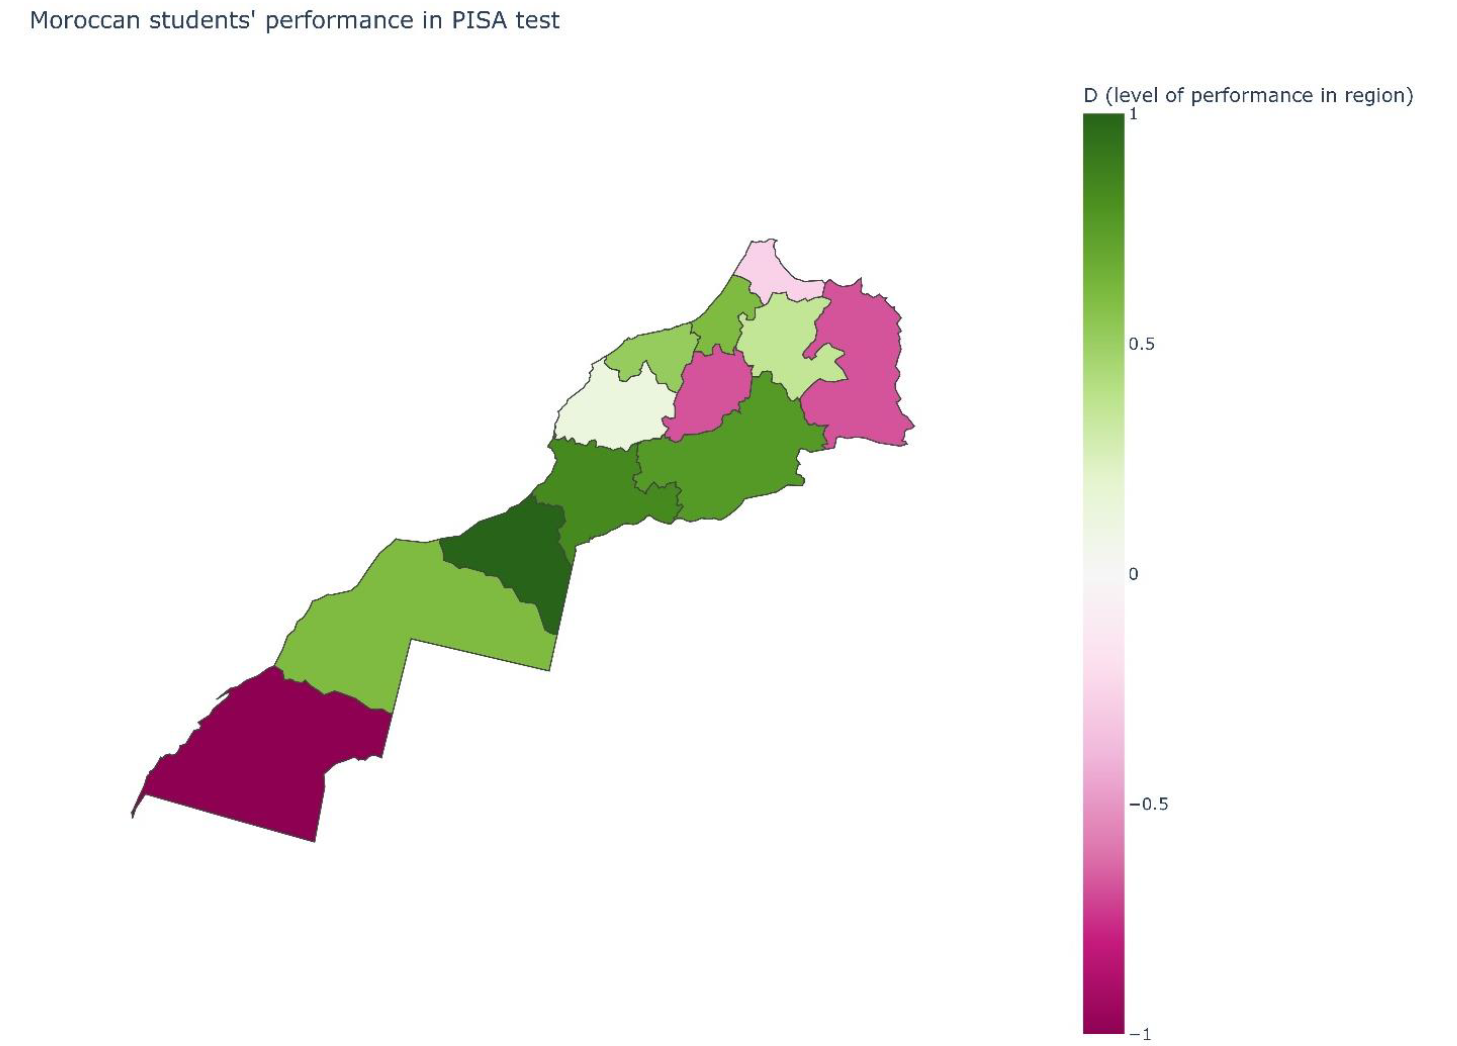
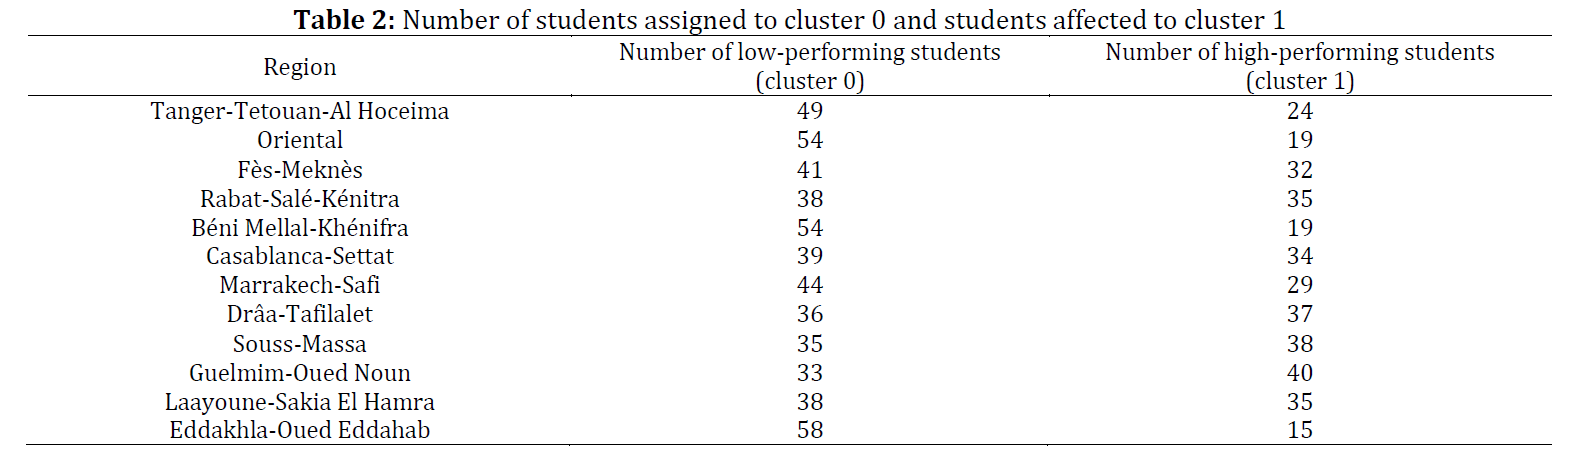
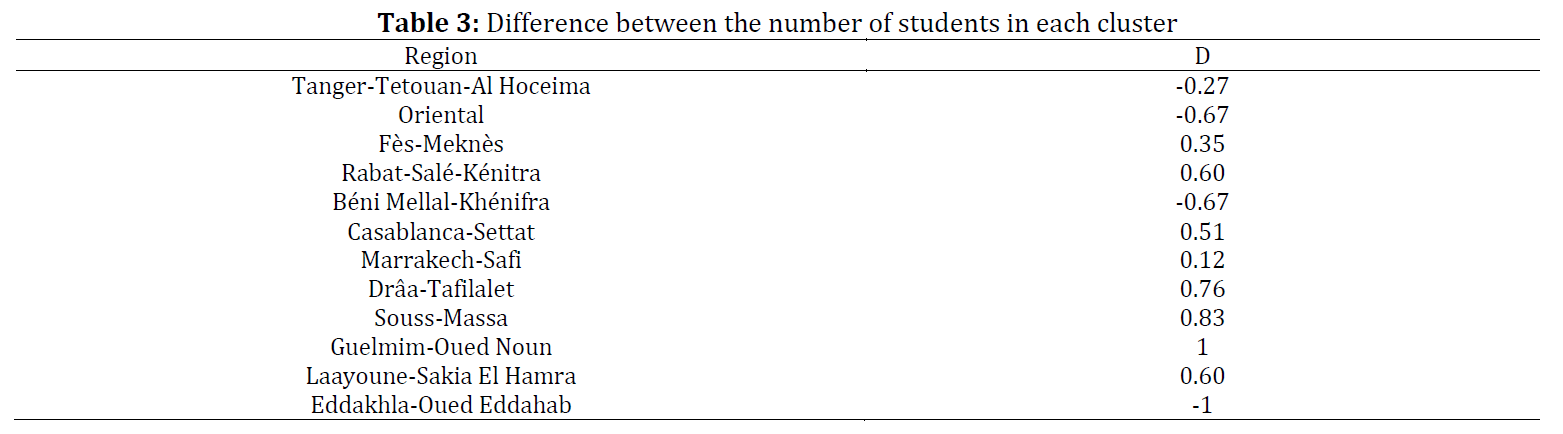
This study highlights the ongoing nature of the school reform movement, emphasizing the need for continuous attention and action. Despite this effort, academic performance has exhibited relative stability in recent years, while significant regional performance disparities persist. Addressing these inequalities requires novel approaches to enhance educational quality. Past research has explored clustering algorithms in developed countries, providing insights into personalized teaching strategies based on students' learning style preferences. In response, our research aims to identify underperforming regions in Morocco, necessitating attention and intervention. We employ an unsupervised deep learning method called "deep embedding clustering" to group Moroccan students based on their performance. The results are subsequently visualized on a choropleth map, revealing intricate patterns and trends in educational performance that might not be immediately apparent. The analysis employs the comprehensive program for international student assessment (PISA) dataset, encompassing individual students' responses and plausible values reflecting cognitive abilities. The findings indicate that the "Guelmim-Oued Noun" region exhibits the highest performance level among all regions, while "Dakhla-Oued Eddahab," "Béni Mellal-Khénifra," and "Oriental" regions display lower performance levels. As a result, this study urges policymakers to incorporate tailored measures into regional policies to improve students' educational outcomes.
© 2023 The Authors. Published by IASE.
This is an
Keywords: School reform movement, Academic performance, Regional performance inequalities, Clustering algorithms, Deep embedding clustering
Article History: Received 22 January 2023, Received in revised form 17 May 2023, Accepted 22 May 2023
Acknowledgment
No Acknowledgment.
Compliance with ethical standards
Conflict of interest: The author(s) declared no potential conflicts of interest with respect to the research, authorship, and/or publication of this article.
Citation:
Tammouch I, Elouafi A, Eddarouich S, and Touahni R (2023). Identifying low-performing regions in Moroccan education: A deep learning approach using the PISA dataset. International Journal of Advanced and Applied Sciences, 10(7): 138-144
Figures
Tables
----------------------------------------------
References (16)
- Bengio Y, Lamblin P, Popovici D, and Larochelle H (2006). Greedy layer-wise training of deep networks. In the 19th International Conference on Neural Information Processing Systems, MIT Press, Vancouver, Canada, 19: 153-160. https://doi.org/10.7551/mitpress/7503.003.0024 [Google Scholar]
- Brunello G and Rocco L (2013). The effect of immigration on the school performance of natives: Cross country evidence using PISA test scores. Economics of Education Review, 32: 234-246. https://doi.org/10.1016/j.econedurev.2012.10.006 [Google Scholar]
- Davies DL and Bouldin DW (1979). A cluster separation measure. IEEE Transactions on Pattern Analysis and Machine Intelligence, PAMI-1(2): 224-227. https://doi.org/10.1109/TPAMI.1979.4766909 [Google Scholar]
- Hinton GE and Salakhutdinov RR (2006). Reducing the dimensionality of data with neural networks. Science, 313(5786): 504-507. https://doi.org/10.1126/science.1127647 [Google Scholar] PMid:16873662
- Kozak M. (2012). “A dendrite method for cluster analysis” by Caliński and Harabasz: A classical work that is far too often incorrectly cited. Communications in Statistics-Theory and Methods, 41(12): 2279-2280. https://doi.org/10.1080/03610926.2011.560741 [Google Scholar]
- Lailiyah S, Yulsilviana E, and Andrea R (2019). Clustering analysis of learning style on Anggana high school student. TELKOMNIKA (Telecommunication Computing Electronics and Control), 17(3): 1409-1416. https://doi.org/10.12928/telkomnika.v17i3.9101 [Google Scholar]
- Pasina I, Bayram G, Labib W, Abdelhadi A, and Nurunnabi M (2019). Clustering students into groups according to their learning style. MethodsX, 6: 2189-2197. https://doi.org/10.1016/j.mex.2019.09.026 [Google Scholar] PMid:31667119 PMCid:PMC6812368
- Pholphirul P and Teimtad S (2018). Living with parents and educational outcomes in developing countries: Empirical evidence from PISA Thailand. Journal of Population Research, 35: 87-105. https://doi.org/10.1007/s12546-017-9196-1 [Google Scholar]
- Rousseeuw PJ (1987). Silhouettes: A graphical aid to the interpretation and validation of cluster analysis. Journal of Computational and Applied Mathematics, 20: 53-65. https://doi.org/10.1016/0377-0427(87)90125-7 [Google Scholar]
- Schleicher A (2019). PISA 2018: Insights and interpretations. Available online at: https://www.oecd.org/pisa/PISA%202018%20Insights%20and%20Interpretations%20FINAL%20PDF.pdf
- Shovon HIM and Haque M (2012). An approach of improving students academic performance by using k means clustering algorithm and decision tree. International Journal of Advanced Computer Science and Applications, 3(8): 146-149. https://doi.org/10.14569/IJACSA.2012.030824 [Google Scholar]
- Srivastava N, Hinton G, Krizhevsky A, Sutskever I, and Salakhutdinov R (2014). Dropout: A simple way to prevent neural networks from overfitting. The Journal of Machine Learning Research, 15(1): 1929-1958. [Google Scholar]
- Stewart J and Kennelly PJ (2010). Illuminated choropleth maps. Annals of the Association of American Geographers, 100(3): 513-534. https://doi.org/10.1080/00045608.2010.485449 [Google Scholar]
- Van der Maaten L and Hinton G (2008). Visualizing data using t-SNE. Journal of Machine Learning Research, 9: 2579-2605. [Google Scholar]
- Wu M (2004). Plausible values. Rasch Measurement Transactions, 18(2): 976-978. [Google Scholar]
- Xie J, Girshick R, and Farhadi A (2016). Unsupervised deep embedding for clustering analysis. In the 33rd International Conference on Machine Learning, PMLR, New York, USA: 478-487. [Google Scholar]