
International
ADVANCED AND APPLIED SCIENCES
EISSN: 2313-3724, Print ISSN: 2313-626X
Frequency: 12
![]()
Volume 8, Issue 12 (December 2021), Pages: 110-116

----------------------------------------------
Original Research Paper
Title: Development of a prediction model based on linear regression to estimate the success rates of seafood caught from different catching centers
Author(s): Vinu Sherimon 1, *, P. C. Sherimon 2, Alaa Ismaeel 2
Affiliation(s):
1Department of Information Technology, University of Technology and Applied Sciences, Muscat, Oman
2Faculty of Computer Studies, Arab Open University, Muscat, Oman

* Corresponding Author.
 Corresponding author's ORCID profile: https://orcid.org/0000-0003-4923-2841
Digital Object Identifier:
https://doi.org/10.21833/ijaas.2021.12.013
Abstract:
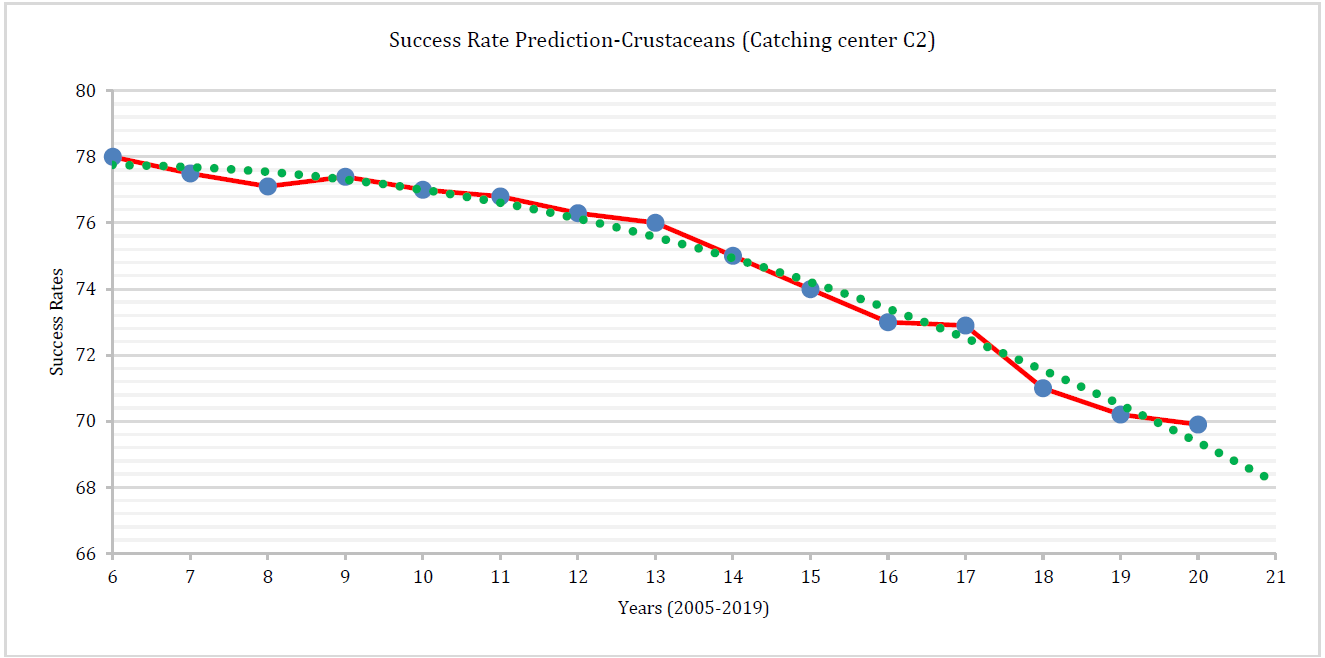
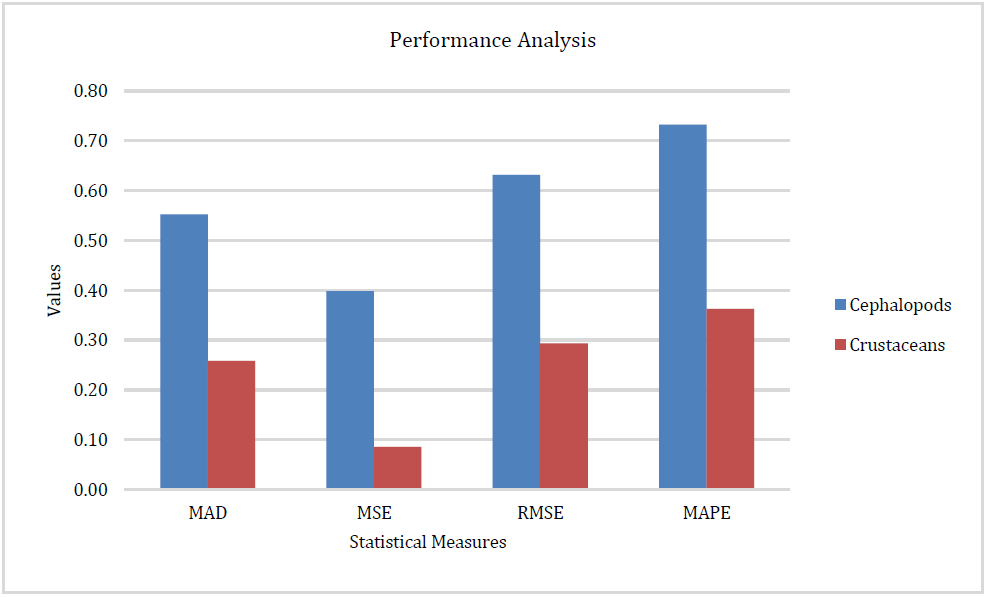
For businesses and organizations that aim to be efficient and competitive on a worldwide basis, food quality assurance is extremely important. To maintain constant quality, global markets demand high food hygiene and safety standards. Intelligent software to assure fish quality is uncommon in the fishing industry. Most seafood processing industries utilize Total Quality Management (TQM) systems to ensure product safety and quality. These protections ensure that significant quality risks are kept within acceptable tolerance limits. However, there are no ways for calculating the success rates of seafood obtained from different catching centers. The purpose of this study is to develop algorithms for predicting the success rates of seafood caught at different catching centers. To determine the best model to match the data, the algorithms employ the Least-Square Curve Fitting approach. The success rates are predicted using the best-fit model that results. The bestFitModelFinder algorithm is used to find the best model for the input data, while the prediction of quality algorithm is used to predict the success rate. The algorithms were tested using data obtained from a seafood company between January 2000 and December 2019. Statistical metrics such as mean absolute deviation (MAD), mean square error (MSE), root mean square error (RMSE) and mean absolute percentage error (MAPE) are used to evaluate the prediction accuracy of the presented algorithms. The algorithms' performance analysis resulted in lower error levels. The proposed algorithms can assist seafood enterprises in determining the quality of seafood items sourced from various fishing areas.
© 2021 The Authors. Published by IASE.
This is an
Keywords: Prediction of seafood quality, Linear regression-based prediction, Least-square method, LSM, Fish quality
Article History: Received 17 July 2021, Received in revised form 23 October 2021, Accepted 23 October 2021
Acknowledgment
No Acknowledgment.
Funding
The research leading to these results has received funding from the Research Council (TRC) of the Sultanate of Oman under the Block Funding Program BFP/ RGP/ ICT/ 18/ 113.
Compliance with ethical standards
Conflict of interest: The author(s) declared no potential conflicts of interest with respect to the research, authorship, and/or publication of this article.
Citation:
Sherimon V, Sherimon PC, and Ismaeel A (2021). Development of a prediction model based on linear regression to estimate the success rates of seafood caught from different catching centers. International Journal of Advanced and Applied Sciences, 8(12): 110-116
Figures
Fig. 1 Fig. 2 Fig. 3 Fig. 4 Fig. 5 Fig. 6
Tables
No Table
----------------------------------------------
References (16)
- Freund RJ, Wilson WJ, and Sa P (2006). Regression analysis. Elsevier, Amsterdam, Netherlands. [Google Scholar]
- García MR, Cabo ML, Herrera JR, Ramilo-Fernández G, Alonso AA, and Balsa-Canto E (2017). Smart sensor to predict retail fresh fish quality under ice storage. Journal of Food Engineering, 197: 87-97. https://doi.org/10.1016/j.jfoodeng.2016.11.006 [Google Scholar]
- Guest PG and Guest PG (2012). Numerical methods of curve fitting. Cambridge University Press, Cambridge, UK. [Google Scholar]
- Hardle W and Mammen E (1993). Comparing nonparametric versus parametric regression fits. The Annals of Statistics, 21: 1926-1947. https://doi.org/10.1214/aos/1176349403 [Google Scholar]
- Howell JQ (1971). A least-square distance curve-fitting technique. National Aeronautics and Space Administration, Washington, USA. [Google Scholar]
- Huss HH (1994). Assurance of seafood quality. Food and Agriculture Organization, Rome, Italy. [Google Scholar]
- Khoshnoudi-Nia S and Moosavi-Nasab M (2019). Prediction of various freshness indicators in fish fillets by one multispectral imaging system. Scientific Reports, 9(1): 1-11. https://doi.org/10.1038/s41598-019-51264-z [Google Scholar] PMid:31605023 PMCid:PMC6789145
- Kuhn M and Johnson K (2013). A short tour of the predictive modeling process. In: Kuhn M and Johnson K (Eds.), Applied predictive modeling: 19-26. Springer, New York, USA. https://doi.org/10.1007/978-1-4614-6849-3 [Google Scholar]
- Motulsky HJ and Ransnas LA (1987). Fitting curves to data using nonlinear regression: A practical and nonmathematical review. The FASEB Journal, 1(5): 365-374. https://doi.org/10.1096/fasebj.1.5.3315805 [Google Scholar] PMid:3315805
- Myttenaere DA, Golden B, Le Grand B, and Rossi F (2016). Mean absolute percentage error for regression models. Neurocomputing, 192: 38-48. https://doi.org/10.1016/j.neucom.2015.12.114 [Google Scholar]
- Oliveira DCAF, Da Cruz AG, Tavolaro P, and Corassin CH (2016). Food safety: Good manufacturing practices (GMP), Sanitation standard operating procedures (SSOP), Hazard analysis and critical control point (HACCP). In: Barros-Velázquez J (Ed.), Antimicrobial food packaging: 129-139. Academic Press, Cambridge, USA. https://doi.org/10.1016/B978-0-12-800723-5.00010-3 [Google Scholar]
- Pham H (2006). Springer handbook of engineering statistics. Springer Science and Business Media, Berlin, Germany. https://doi.org/10.1007/978-1-84628-288-1 [Google Scholar]
- Picard RR and Cook RD (1984). Cross-validation of regression models. Journal of the American Statistical Association, 79(387): 575-583. https://doi.org/10.1080/01621459.1984.10478083 [Google Scholar]
- Roos N, Mazharul Islam M, and Thilsted SH (2003). Small fish is an important dietary source of vitamin A and calcium in rural Bangladesh. International Journal of Food Sciences and Nutrition, 54(5): 329-339. https://doi.org/10.1080/09637480120092125 [Google Scholar] PMid:12907404
- Steel RGD and Torrie JH (1960). Principles and procedures of statistics. McGraw-Hill Book Company Inc., New York, USA. [Google Scholar]
- WHO (2015). WHO estimates of the global burden of foodborne diseases. World Health Organization, Geneva, Switzerland. [Google Scholar]