
International
ADVANCED AND APPLIED SCIENCES
EISSN: 2313-3724, Print ISSN: 2313-626X
Frequency: 12
![]()
Volume 7, Issue 10 (October 2020), Pages: 30-37

----------------------------------------------
Original Research Paper
Title: Effect of outliers on the coefficient of determination in multiple regression analysis with the application on the GPA for student
Author(s): Afrah Yahya AL Rezami 1, 2, *
Affiliation(s):
1Department of Mathematics, Al-Aflaj College of Science and Humanities Studies, Prince Sattam Bin Abdulaziz University, Al- Kharj, Saudi Arabia
2Department of Statistics and Information, College of Commerce and Economics, Sana'a University, Sana'a, Yemen

* Corresponding Author.
 Corresponding author's ORCID profile: https://orcid.org/0000-0003-1176-0286
Digital Object Identifier:
https://doi.org/10.21833/ijaas.2020.10.004
Abstract:
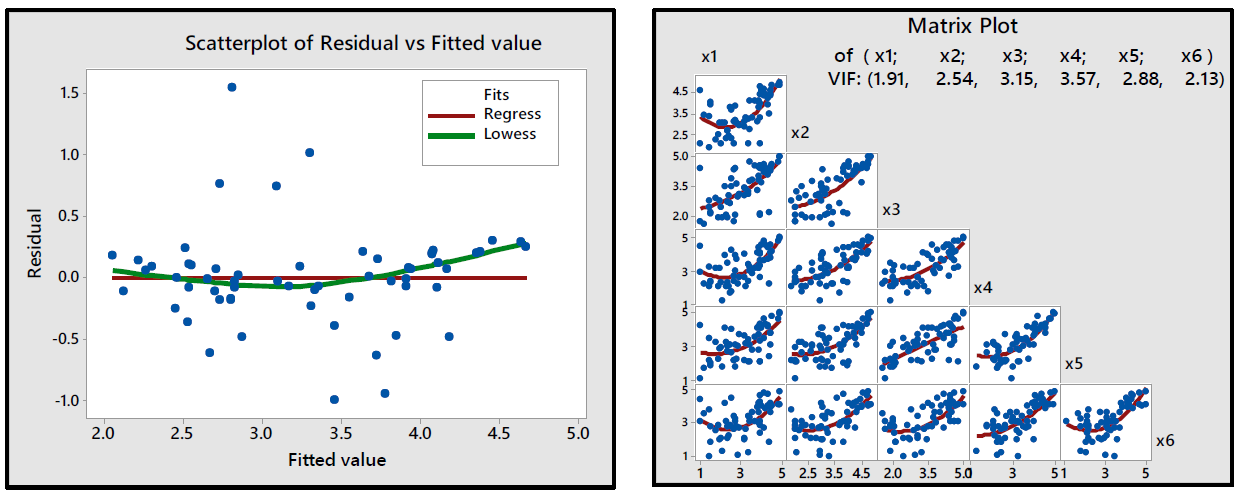
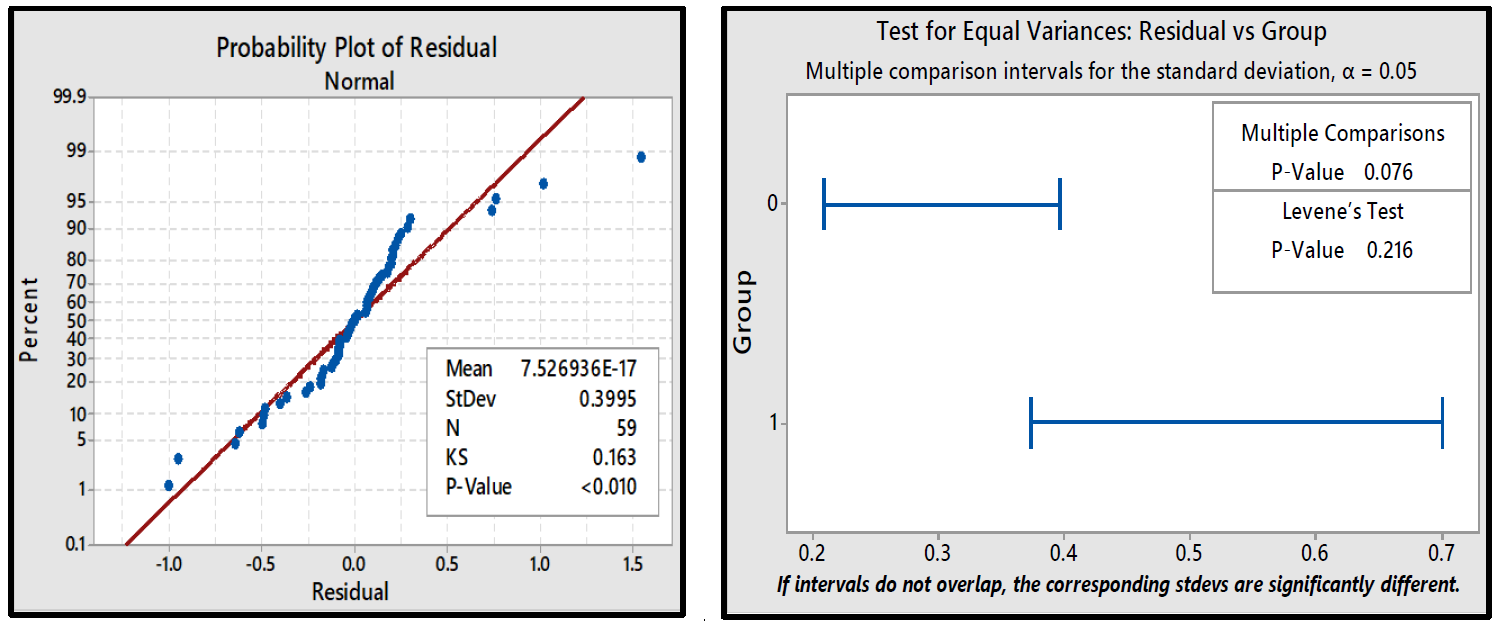
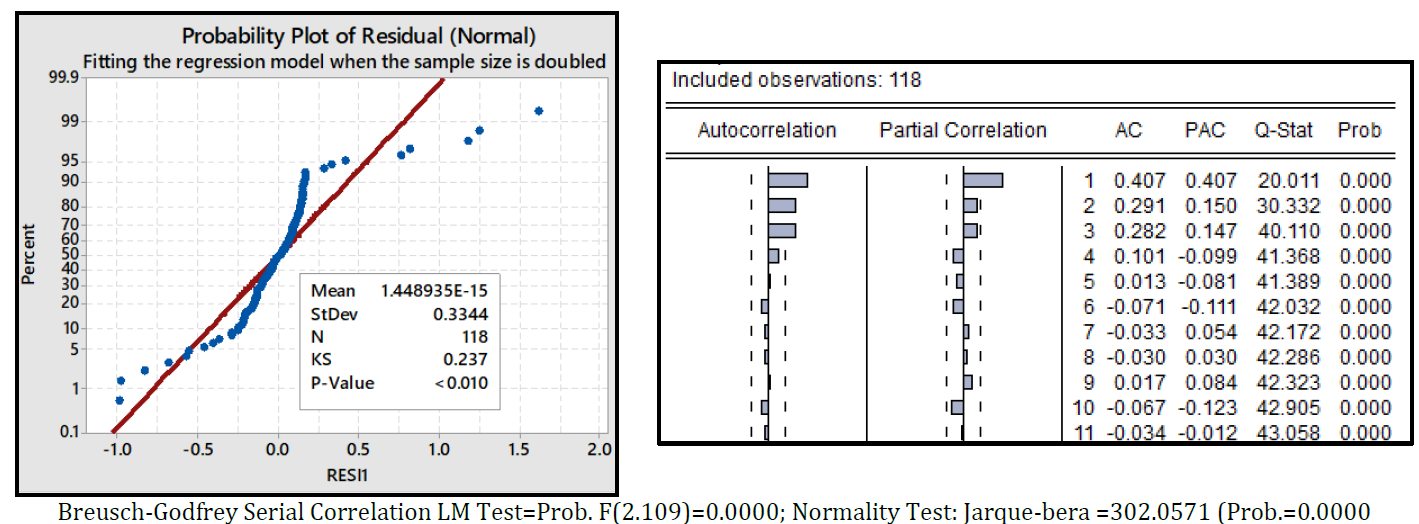
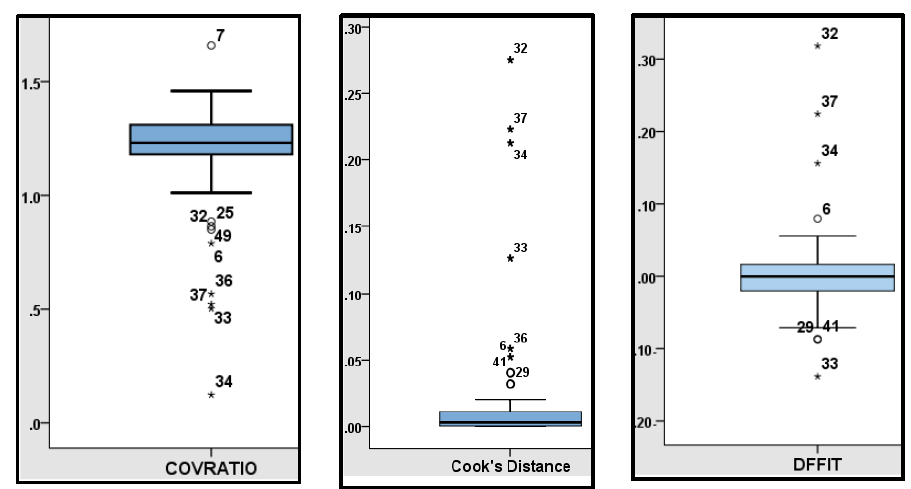
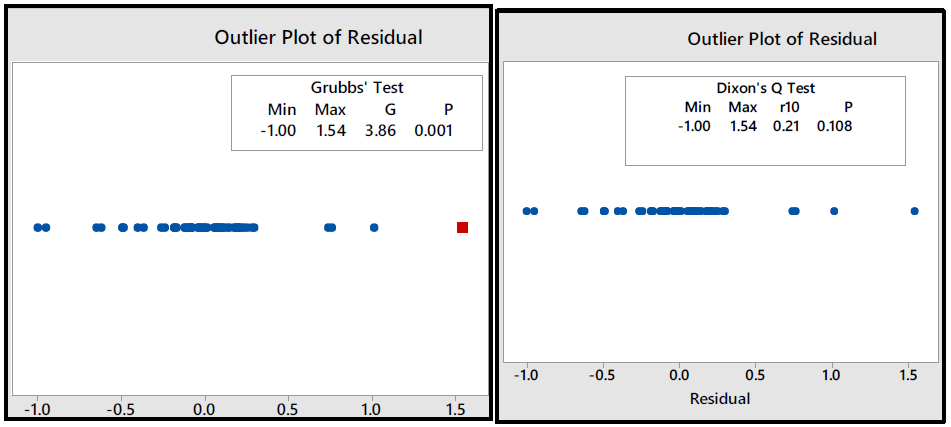
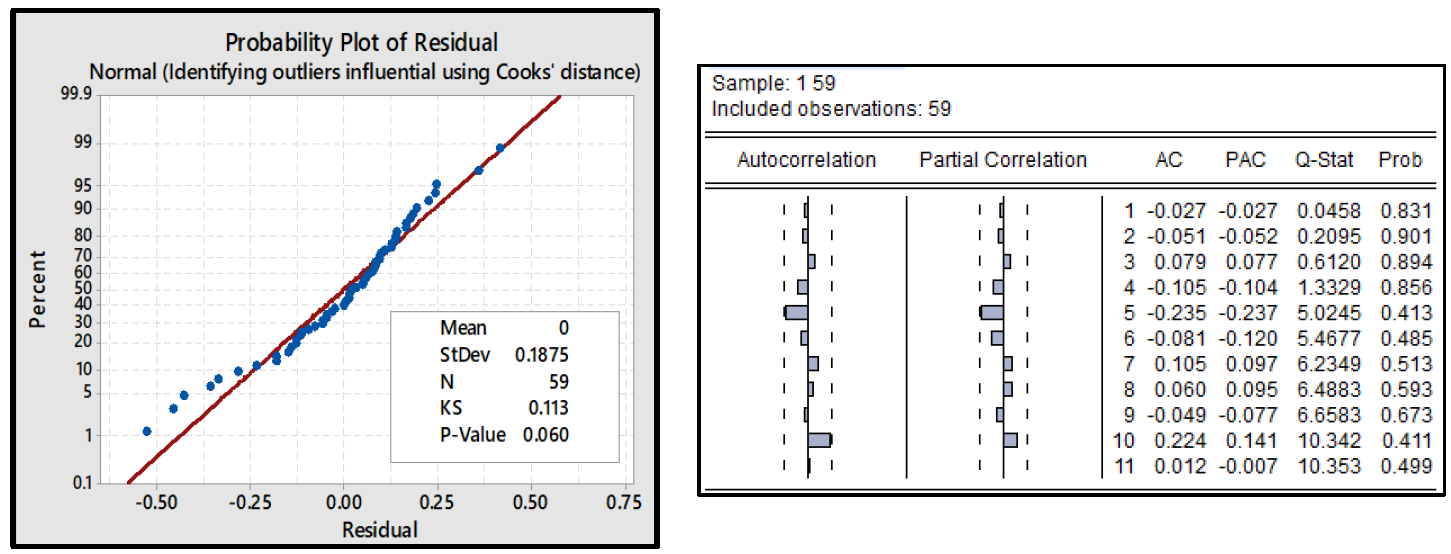
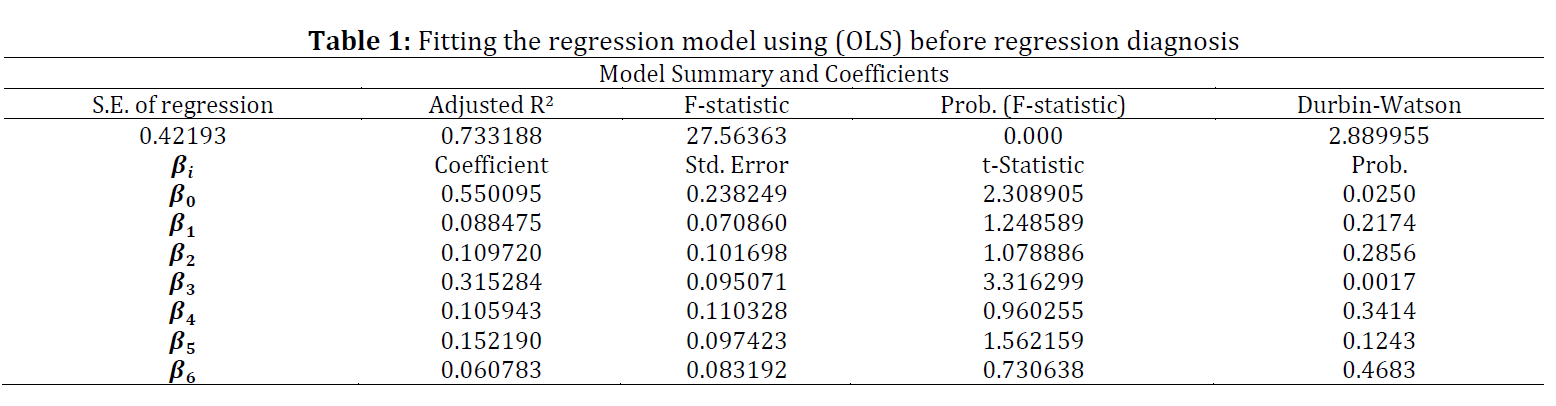
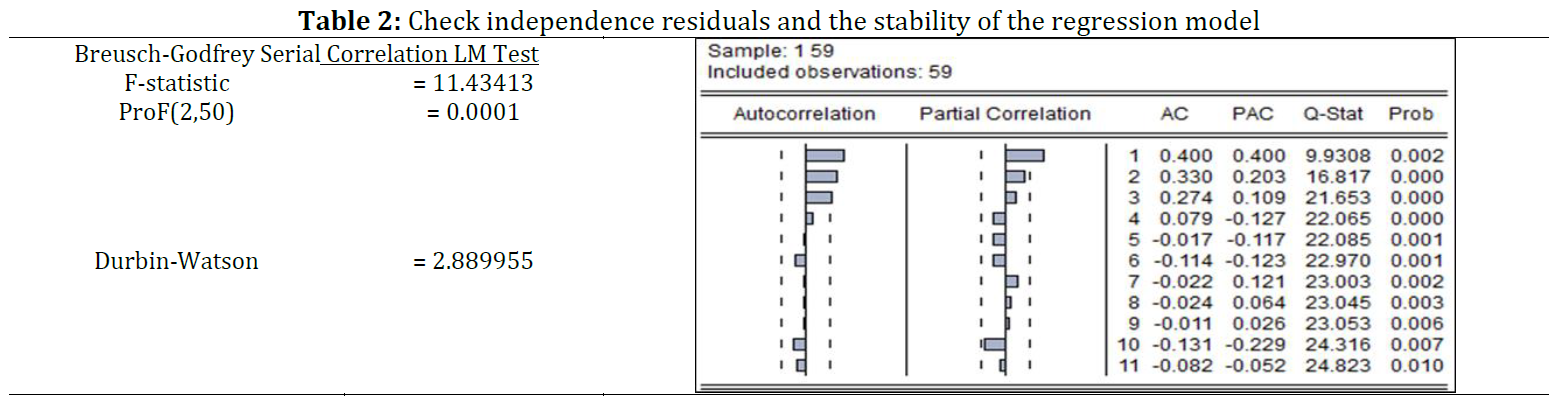
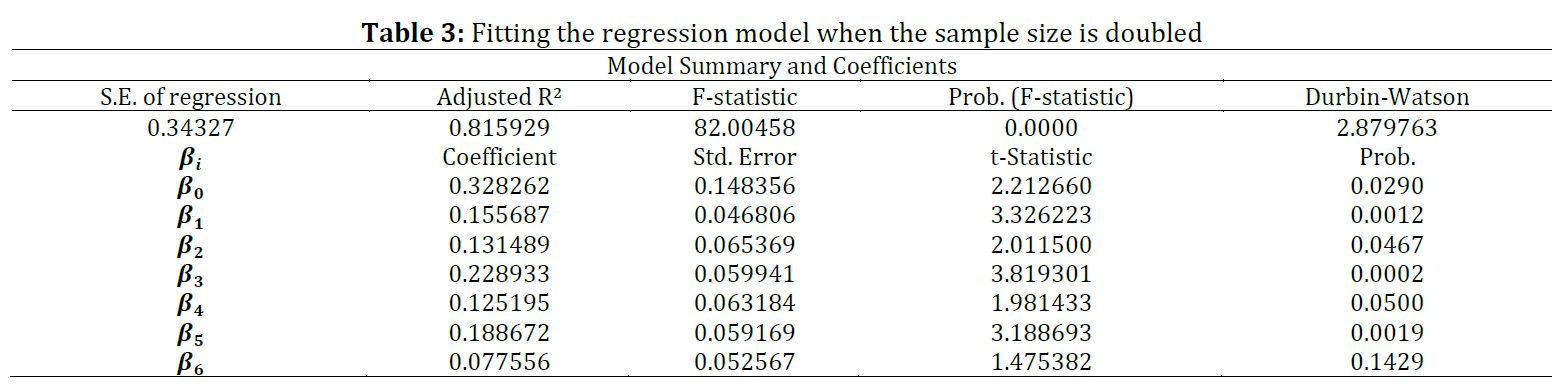
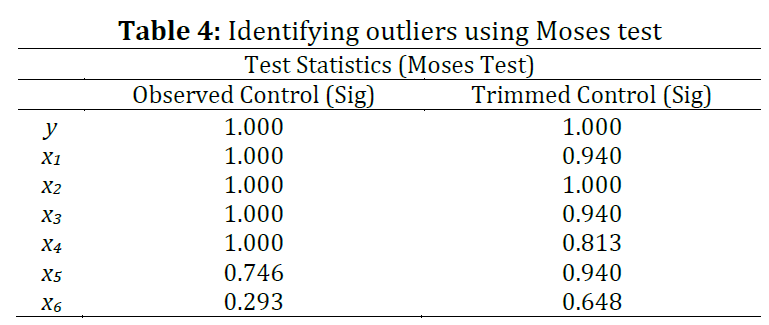
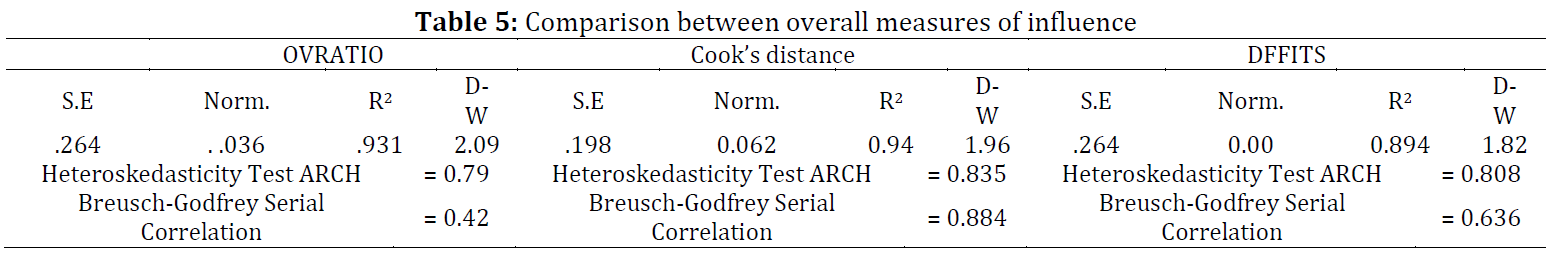
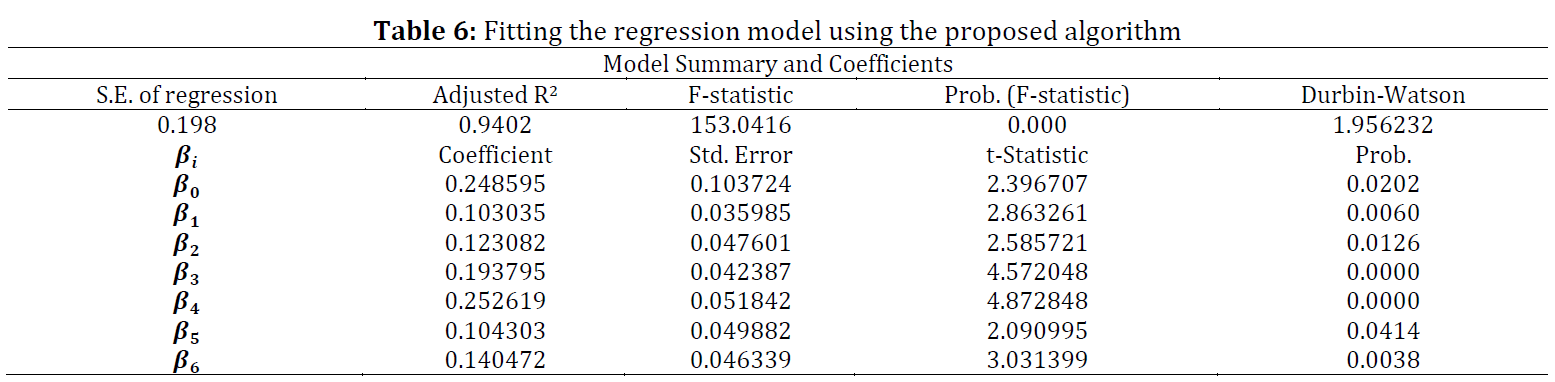
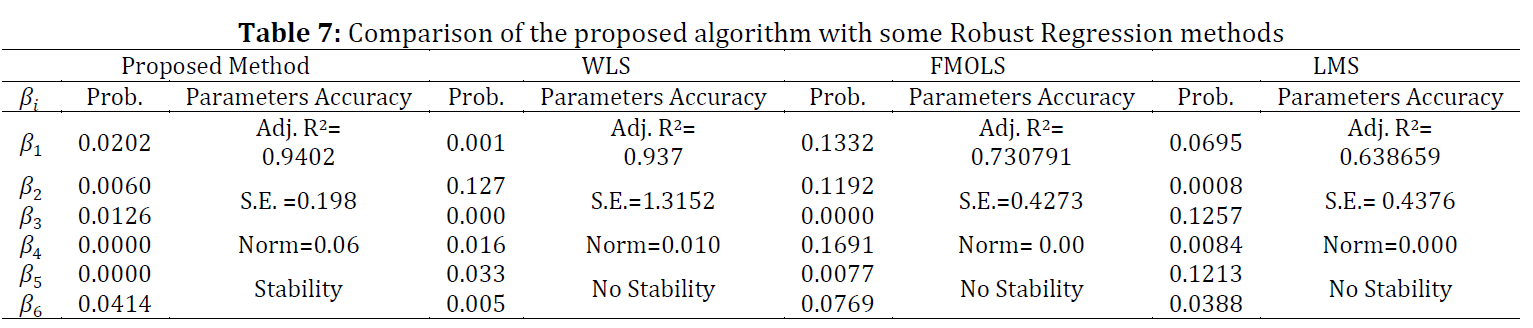
This study aims to solve the problem of contradiction between the statistical significance and real significance of regression parameters when using multiple linear regression analysis. In this regard, an algorithm was presented based on the simple and multiple of determination coefficient, and the sum of averages to estimate multiple outliers when outliers are real. Regression analysis was applied to a phenomenon, whose results are known in advance (The relationship between Semester average and Cumulative average). The results were misleading, and we cannot firmly stand on analysis results. Also, the regression model did not improve much when an increased sample size more than doubled, so the study presents an algorithm for finding a solution to this contradiction. After checking Ordinary Least Squares (OLS) assumptions, outliers were identified, based on Cook's distance because it was the best. The proposed algorithm was compared with some robust regression methods, [Weighted Least Squares, Fully Modified Least Squares, and Least Median of Squares]. The results proved that the proposed method is a robust solution for outliers’ estimation. Therefore, it is recommended to use the proposed algorithm to estimate multiple outliers on other similar phenomena (e.g., The algorithm can be applied to a credit card transaction control system in a bank), and also software Packages statistical for the proposed algorithm. Also, the novelty of this study can be observed by investigating testing the significance of outliers as most of the previous researchers were interested in diagnosing the outliers without checking its significance.
© 2020 The Authors. Published by IASE.
This is an
Keywords: Regression, Determination coefficient, Outliers, Cumulative average
Article History: Received 14 December 2019, Received in revised form 10 May 2020, Accepted 11 June 2020
Acknowledgment:
This project was supported by the Deanship of Scientific Research at Prince Sattam Bin Abdulaziz University under the research project 2017/01/8307.
Compliance with ethical standards
Conflict of interest: The authors declare that they have no conflict of interest.
Citation:
AL Rezami AY (2020). Effect of outliers on the coefficient of determination in multiple regression analysis with the application on the GPA for student. International Journal of Advanced and Applied Sciences, 7(10): 30-37
Figures
Fig. 1 Fig. 2 Fig. 3 Fig. 4 Fig. 5 Fig. 6
Tables
Table 1 Table 2 Table 3 Table 4 Table 5 Table 6 Table 7
----------------------------------------------
References (29)
- Abuzaid A, Hussin AG, and Rambli A (2011). COVRATIO statistic for simple circular regression model. Chiang Mai Journal of Science, 38(3): 321-330. [Google Scholar]
- Adikaram KKLB, Hussein MA, Effenberger M, and Becker T (2014). Outlier detection method in linear regression based on sum of arithmetic progression. The Scientific World Journal, 2014: 821623. https://doi.org/10.1155/2014/821623 [Google Scholar] PMid:25121139 PMCid:PMC4121229
- Alguraibawi M, Midi H, and Imon AHM (2015). A new robust diagnostic plot for classifying good and bad high leverage points in a multiple linear regression model. Mathematical Problems in Engineering, 2015: 279472. https://doi.org/10.1155/2015/279472 [Google Scholar]
- Altland HW (1999). Regression analysis: Statistical modeling of a response variable. Technometrics, 41(4): 367-368. https://doi.org/10.1080/00401706.1999.10485936 [Google Scholar]
- Belsley DA, Kuh E, and Welsch RE (1980). Regression diagnostics: Identifying influential data and sources of collinearity. John Wiley and Sons, New York, USA. https://doi.org/10.1002/0471725153 [Google Scholar]
- Cerioli A, Riani M, and Torti F (2013). Size and power of multivariate outlier detection rules. In: Lausen B, Van den Poel D, and Ultsch A (Eds.), Algorithms from and for nature and life: 3-17. Springer, Cham, Switzerland. https://doi.org/10.1007/978-3-319-00035-0_1 [Google Scholar]
- Choonpradub C and McNeil D (2005). Can the box plot be improved? Songklanakarin Journal of Science and Technology, 27(3): 649-657. [Google Scholar]
- Cook RD (1977). Detection of influential observation in linear regression. Technometrics, 19(1): 15-18. https://doi.org/10.1080/00401706.1977.10489493 [Google Scholar]
- Cook RD and Weisberg S (1982). Residuals and influence in regression. Chapman and Hall, New York, USA. [Google Scholar]
- Freund RJ, Wilson WJ, and Sa P (2006). Regression analysis statistical modeling of a response. Elsevier, Edinburgh, London, UK. [Google Scholar]
- Gad AM and Qura ME (2016). Regression estimation in presence of outliers: A comparative study. International Journal of Probability and Statistics, 5(3): 65-72. [Google Scholar]
- Greenwell BM, McCarthy AJ, Boehmke BC, and Liu D (2018). Residuals and diagnostics for binary and ordinal regression models: An introduction to the sure package. The R Journal, 10(1): 381-394. https://doi.org/10.32614/RJ-2018-004 [Google Scholar]
- Huber PJ and Ronchetti EM (1981). Robust statistics. John Wiley and Sons, New York, USA. https://doi.org/10.1002/0471725250 [Google Scholar]
- Ibrahim SA and Yahya WB (2017). Effects of outliers and multicollinearity on some estimators of linear regression model. Nigeria Statistical Society, 1: 204-209. [Google Scholar]
- Judd CM, McClelland GH, and Ryan CS (2017). Data analysis: A model comparison approach to regression, ANOVA, and beyond. Routledge, Abingdon, UK. https://doi.org/10.4324/9781315744131 [Google Scholar]
- Kim JT (2000). An order selection criterion for testing goodness of fit. Journal of the American Statistical Association, 95(451): 829-835. https://doi.org/10.1080/01621459.2000.10474274 [Google Scholar]
- Müller HG (1992). Goodness-of-fit diagnostics for regression models. Scandinavian Journal of Statistics, 19: 157-172. [Google Scholar]
- Neter J, Kutner M, Nachtsheim C, and Wasserman W (1996). Applied linear regression models. 3rd Edition, Irwin, Chicago, USA. [Google Scholar]
- Nussbaum EM (2014). Categorical and nonparametric data analysis: Choosing the best statistical technique. Routledge, Abingdon, UK. https://doi.org/10.4324/9780203122860 [Google Scholar]
- Park CG, Kim I, and Lee YS (2012). Error variance estimation via least squares for small sample nonparametric regression. Journal of Statistical Planning and Inference, 142(8): 2369-2385. https://doi.org/10.1016/j.jspi.2012.02.050 [Google Scholar]
- Rahman SK, Sathik MM, and Kannan KS (2012). Multiple linear regression models in outlier detection. International Journal of Research in Computer Science, 2(2): 23-28. https://doi.org/10.7815/ijorcs.22.2012.018 [Google Scholar]
- Rahmatullah Imon AHM and Ali MM (2005). Simultaneous identification of multiple outliers and high leverage points in linear regression. Journal of the Korean Data and Information Science Society, 16(2): 429-444. [Google Scholar]
- Richard F, Gunst M, and Robert L (2019). Regression analysis and its application: A data-oriented Approach. CRC Press, Boca Raton, USA. https://doi.org/10.1201/9780203741054 [Google Scholar]
- Rousseeuw PJ and Leroy AM (1987). Robust regression and outlier detection. John Wiley and Sons, New York, USA. https://doi.org/10.1002/0471725382 [Google Scholar]
- Salleh FHM, Arif SM, Zainudin S, and Firdaus-Raih M (2015). Reconstructing gene regulatory networks from knock-out data using Gaussian noise model and Pearson correlation coefficient. Computational Biology and Chemistry, 59: 3-14. https://doi.org/10.1016/j.compbiolchem.2015.04.012 [Google Scholar] PMid:26278974
- Srivastava MS and Lee GC (1984). On the distribution of the correlation coefficient when sampling from a mixture of two bivariate normal densities: Robustness and the effect of outliers. Canadian Journal of Statistics, 12(2): 119-133. https://doi.org/10.2307/3315176 [Google Scholar]
- Turkan S, Meral CC, and Oniz T (2012). Outlier detection by regression diagnostics based on robust parameter estimates. Hacettepe Journal of Mathematics and Statistics, 41(1): 147-155. [Google Scholar]
- Valliant R (2012). Regression diagnostics in survey data. Joint Program in Survey Methodology, University of Maryland and University of Michigan, USA. [Google Scholar]
- Weisberg S (2013). Applied linear regression. 4th Edition, Wiley, Hoboken, USA. [Google Scholar]